


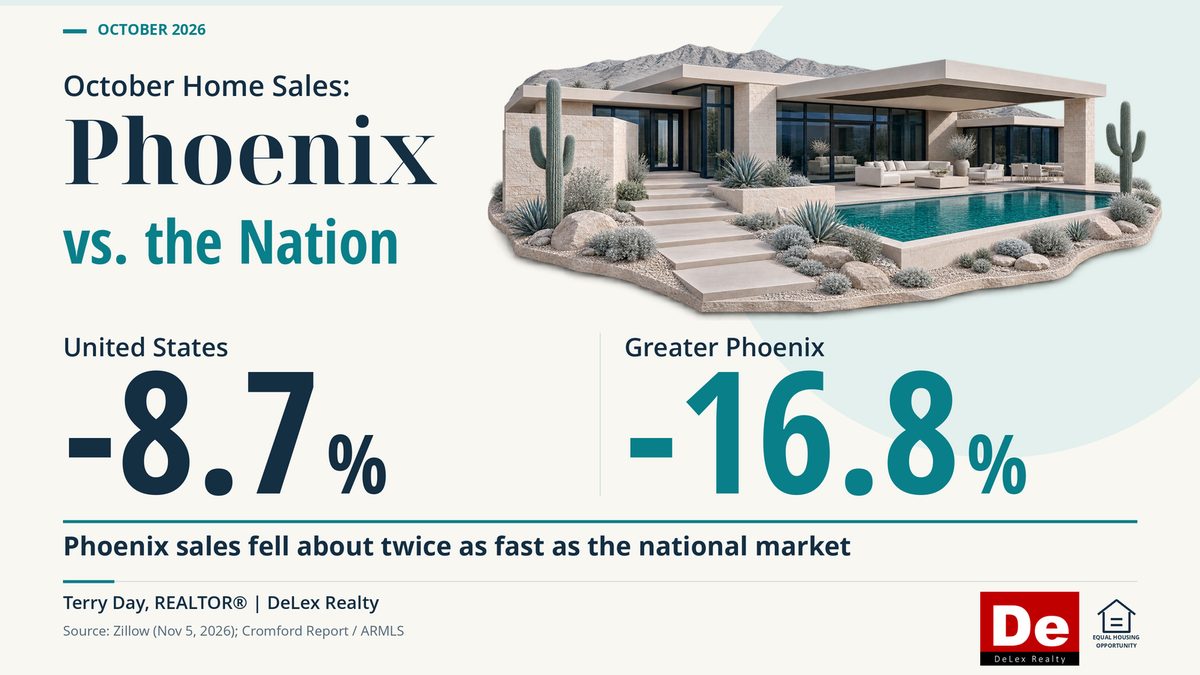
Zillow's October housing report made headlines last week. Newly pending sales across the country dropped about 17% from a year ago, the biggest drop since 2023 and the slowest October for new contracts since 2018. Closed sales fell 8.7%. Higher mortgage rates did most of the damage.
Here in Greater Phoenix, the slowdown hit harder. According to the Cromford Report, which tracks our local MLS data, 5,140 homes closed in October. That's 16.8% fewer than last October and the lowest October count since 2007. In other words, our drop was about twice the national one.
How Phoenix compares with five other major markets
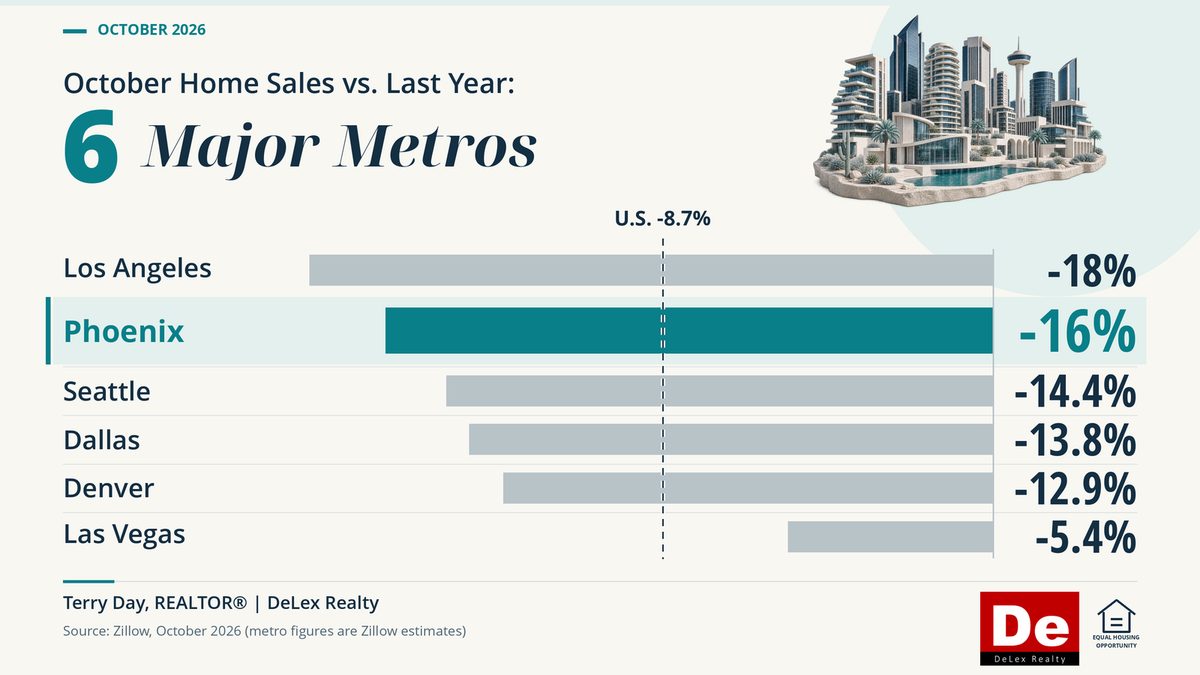
Zillow's report also estimated October sales for each big metro. Here's how Phoenix stacks up against the national number and five markets many of my buyers are moving from or comparing us to.
| Market | October sales vs. last year | Home values vs. last year | Homes for sale vs. last year |
|---|---|---|---|
| United States | -8.7% | +0.7% | +3.4% |
| Los Angeles | -18% | +0.8% | +3.4% |
| Phoenix | -16% | -1.3% | +6.6% |
| Seattle | -14.4% | -3.2% | +21.3% |
| Dallas | -13.8% | -1.9% | -3.3% |
| Denver | -12.9% | -2.1% | +1.3% |
| Las Vegas | -5.4% | -2.7% | +3.6% |
Source: Zillow, October 2026 market report (published Nov. 5, 2026). Metro sales figures are Zillow estimates.
A few things jump out:
- Only Los Angeles slowed more than Phoenix. Sales fell harder in both metros than in Seattle, Dallas or Denver.
- Las Vegas held up best, with sales down just over 5%.
- Phoenix's typical home value is about $438,700, down 1.3% from last year. That's well below Los Angeles, Seattle and Denver, and in line with Las Vegas.
- Seattle's inventory jumped 21%, far more than anywhere else on the list. Phoenix's rose 6.6%.
Where our local MLS numbers differ from Zillow's
Zillow's numbers are estimates built for the whole country. Our local MLS data, as tracked by the Cromford Report, fills in the picture, and in a few places it tells a different story:
- Sales fell a bit more than Zillow estimated. Zillow put Phoenix at about 16% down. Actual MLS closings were down 16.8%, the lowest October count since 2007.
- Supply is rising faster than Zillow shows. Zillow estimated a 6.6% rise in homes for sale. The MLS shows active listings up 8.3% from last year to 28,107, after the biggest October increase since 2023.
- New contracts point to a slow winter. Buyers signed 5,911 contracts in October, 20.1% fewer than a year ago. That backs up Zillow's warning that November will be even slower.
- Watch out for misleading price headlines. The average price per square foot rose 3.8%, but only because more luxury homes closed. The typical home went the other way: the median sales price fell 1.3% to $444,000.
- It's not a fire sale. Sellers still got about 97% of their final list price, the same as last year. Buyers have leverage, but well-priced homes are still selling close to asking.
City by city: Phoenix, the luxury markets and the East Valley
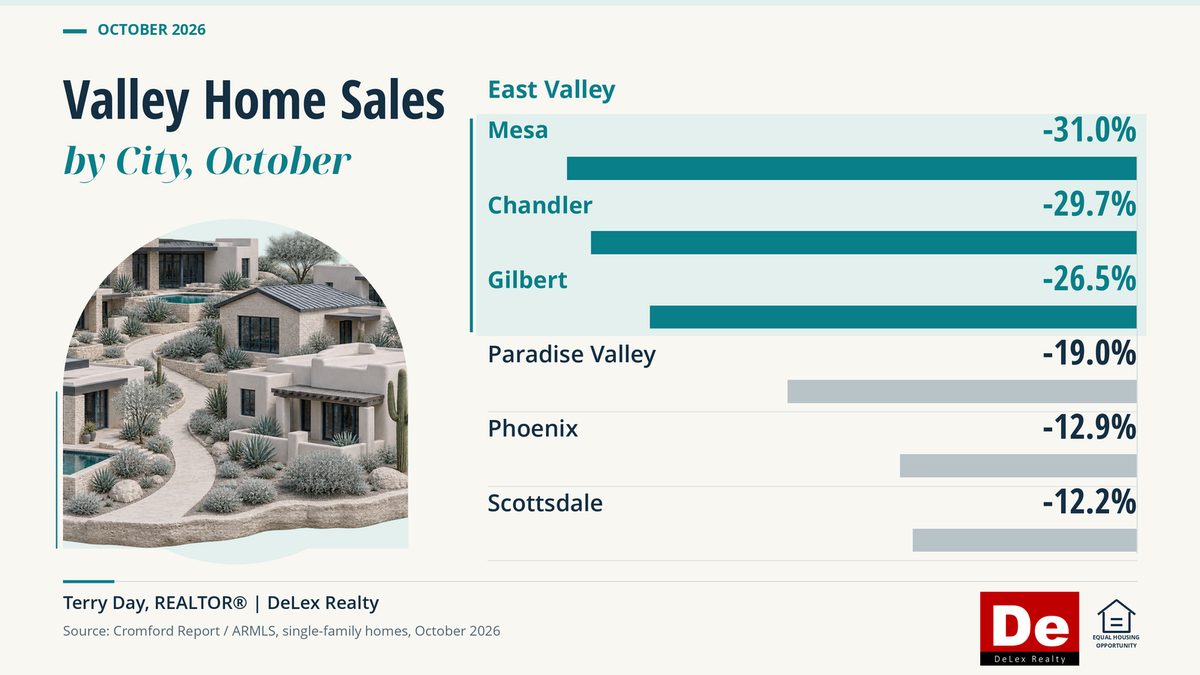
The slowdown didn't hit every part of the Valley the same way.
| Area | Homes sold in October | vs. last year | Median sale price | vs. last year | Homes for sale vs. last year |
|---|---|---|---|---|---|
| Greater Phoenix (all home types) | 5,140 | -16.8% | $444,000 | -1.3% | +8.3% |
| Phoenix | 714 | -12.9% | $480,500 | +2.2% | +16.2% |
| Scottsdale | 324 | -12.2% | $1,229,300 | +6.0% | -3.1% |
| Paradise Valley | 17 | -19.0% | $5,300,000 | +20.5% | +2.9% |
| Mesa | 289 | -31.0% | $480,000 | -4.0% | +9.8% |
| Chandler | 154 | -29.7% | $539,000 | -6.3% | +5.7% |
| Gilbert | 186 | -26.5% | $611,250 | +5.4% | +33.8% |
Source: Cromford Report, based on ARMLS data. City rows are single-family detached homes, October 1–31, 2026 vs. 2025.
- The East Valley slowed the most. Sales in Mesa, Chandler and Gilbert fell 26% to 31%, roughly double the metro-wide drop. Gilbert has a third more homes for sale than a year ago, and prices in Chandler and Mesa slipped. If you're shopping there, you have the most room to negotiate in the Valley.
- Luxury is holding up. Scottsdale sales fell 12%, but its median price rose 6% and it actually has fewer homes for sale than last year. Cromford's index still rates Scottsdale single-family homes a seller's market, the opposite of the Valley as a whole.
- Paradise Valley is its own world. With only 17 sales, one or two big closings swing the median price. What stands out is supply: over 10 months' worth of homes for sale, up from about 8, so buyers at the top have time to choose.
- The city of Phoenix sits in the middle. Sales fell 13%, but listings are up 16%, so buyers have more choices than they've had in a while.
Where buyers have the most leverage: by home type and by area
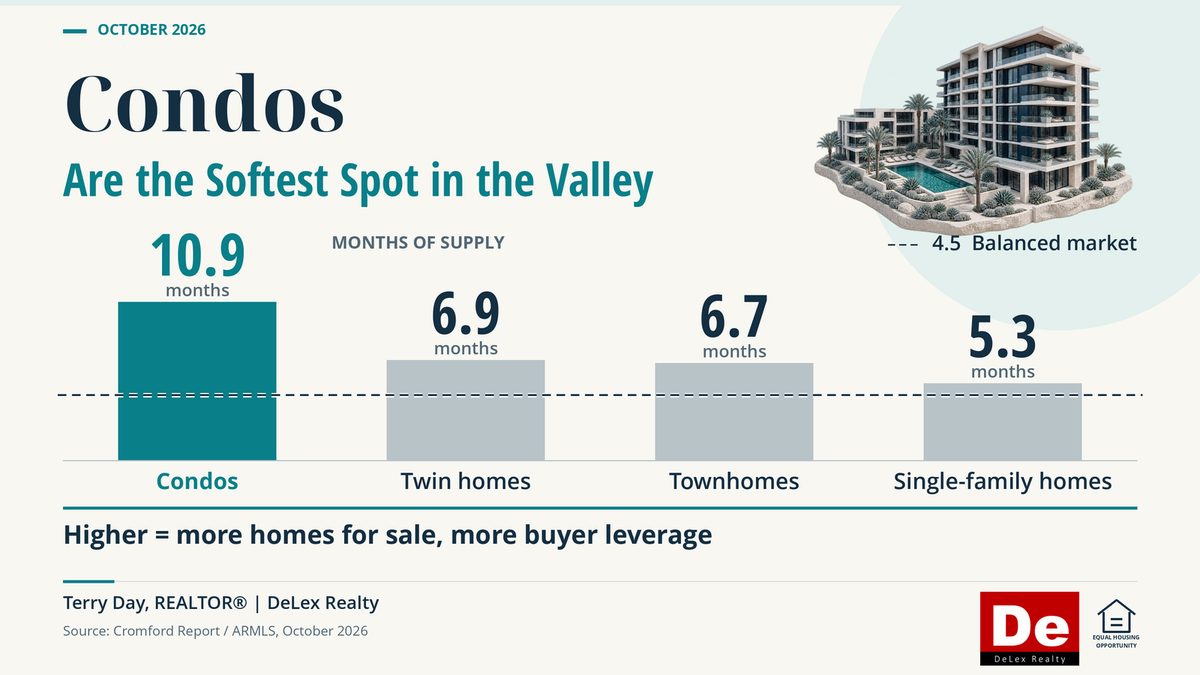
Months of supply is the quickest way to read a market. Under about 4.5 months favors sellers; the higher it climbs, the more the buyer is in charge.
By home type (Greater Phoenix)
| Home type | October sales vs. last year | Months of supply now | A year ago |
|---|---|---|---|
| Condos (apartment style) | -26.2% | 10.9 | 7.8 |
| Twin homes | -9.1% | 6.9 | 5.8 |
| Townhomes | -7.3% | 6.7 | 5.5 |
| Single-family homes | -10.9% | 5.3 | 4.3 |
Source: Cromford Report, based on ARMLS data, October 1–30, 2026 vs. October 2025. Late October closings are still being recorded, so the 2026 drops may shrink slightly.
By area (single-family homes)
| Area | October sales vs. last year | Months of supply now | A year ago |
|---|---|---|---|
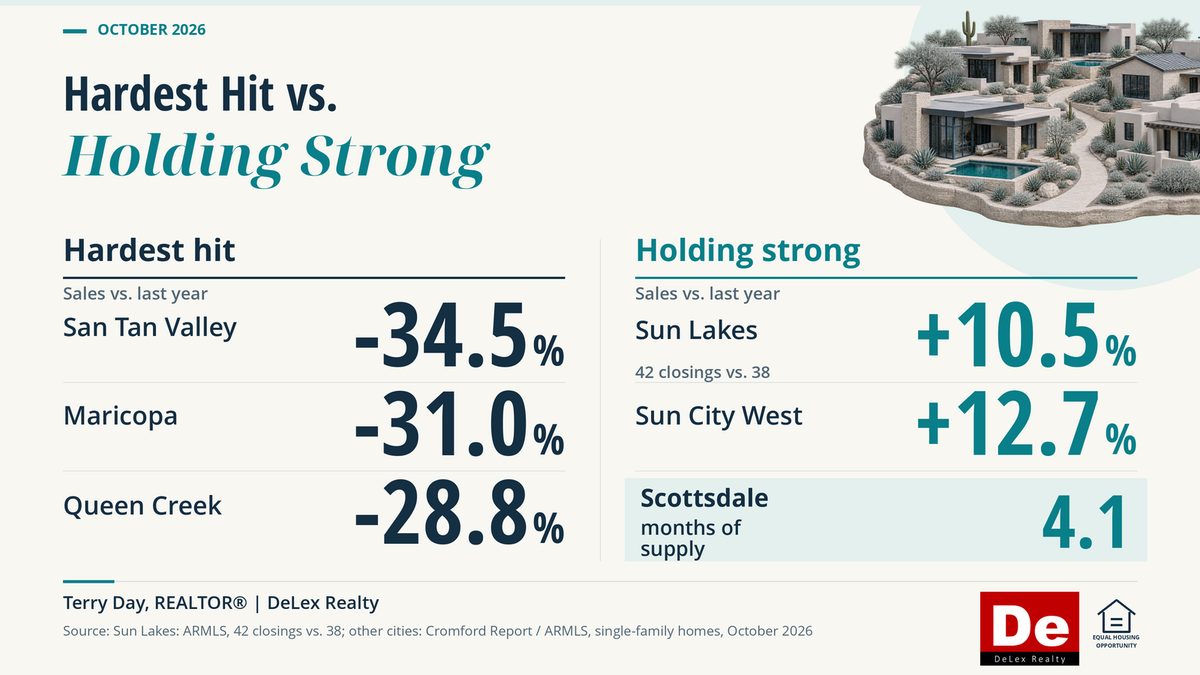
| San Tan Valley | -34.5% | 6.2 | 3.5 |
| Maricopa | -31.0% | 6.0 | 4.1 |
| Buckeye | -11.2% | 5.6 | 4.3 |
| Queen Creek | -28.8% | 5.4 | 3.8 |
| Sun City | -8.2% | 4.8 | 4.0 |
| Scottsdale | -12.2% | 4.1 | 3.7 |
| Sun Lakes | +37.0% | 3.1 | 5.2 |
| Sun City West | +12.7% | 2.9 | 3.9 |
Source: Cromford Report, based on ARMLS data, October 1–31, 2026 vs. 2025. Counting all home types, Sun Lakes closed 42 homes vs. 38 (+10.5%).
- Condos are the softest spot in the Valley. Sales fell more than a quarter, and there's almost 11 months of supply. Financing is part of it: lenders review the whole complex (its HOA budget, insurance and how many units are rentals), not just the unit, so some condos are harder to get a loan on. For a buyer who can finance one, prices are very negotiable.
- Townhomes and twin homes are next. They have nearly 7 months of supply, well above single-family homes. When the market slows, attached homes usually feel it first.
- The outer suburbs are a buyer's market. San Tan Valley, Maricopa and Queen Creek saw sales fall roughly 30% or more, and San Tan Valley's supply jumped from 3.5 to 6.2 months. Buckeye's sales held up better, but listings there are up 15%.
- The big 55+ communities are holding up, at least for houses. Sun City West and Sun Lakes actually sold more homes than last year, with about 3 months of supply. Sun City is softer, with prices down. These figures don't separate out attached homes inside 55+ communities.
- Scottsdale is the tightest major market, still near balance at about 4 months of supply.
Luxury: the part of the market that barely slowed
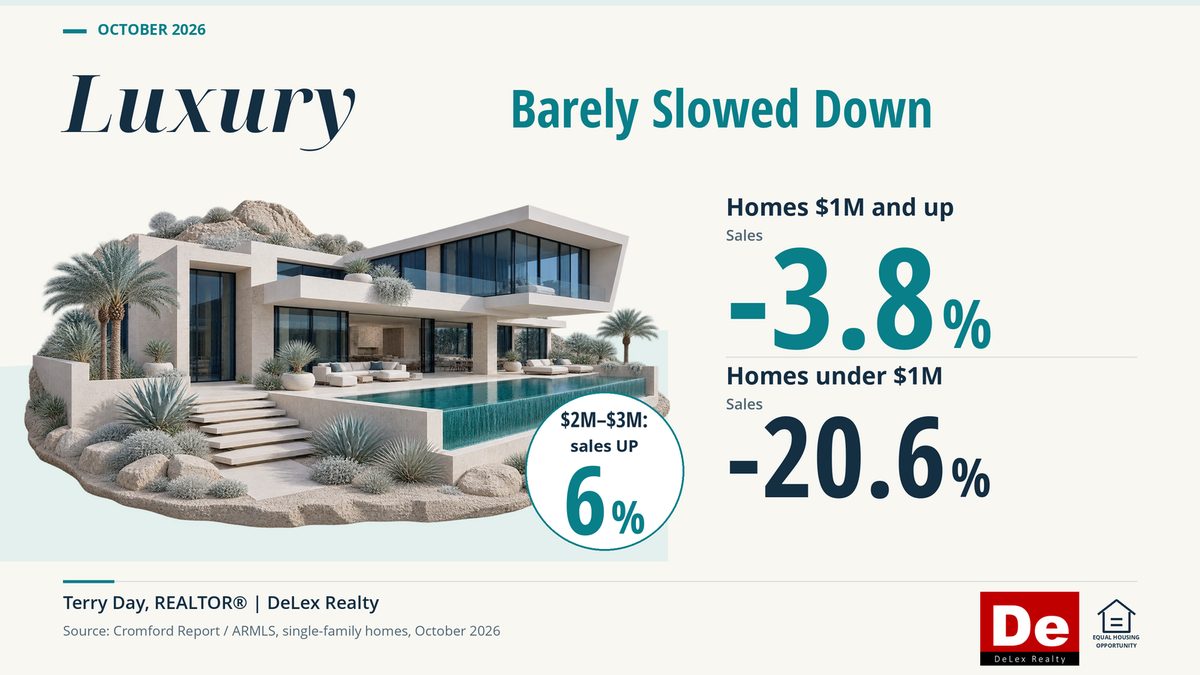
Homes priced at $1 million and up shrugged off most of October's slowdown. Single-family sales above $1 million fell just 3.8% from last year. Below $1 million, they fell 20.6%.
| Price range | Sales vs. last year | Homes for sale vs. last year | Months of supply now |
|---|---|---|---|
| Under $1M | -20.6% | +11.5% | 4.8 |
| $1M–$1.5M | -6.1% | +4.3% | 5.0 |
| $1.5M–$2M | -14.4% | +2.7% | 6.0 |
| $2M–$3M | +6.0% | -8.5% | 5.0 |
| $3M–$5M | -13.2% | +4.8% | 8.1 |
| $5M and up | 26 sales vs. 13 | no change | 12.3 |
Source: Cromford Report, based on ARMLS data. Greater Phoenix single-family detached homes, month ending Nov. 1, 2026. Months of supply for the combined rows (under $1M and $5M+) is calculated from Cromford's band figures.
- Higher rates matter less at the top. Many luxury buyers pay cash or put a lot down, so a rate jump doesn't stop them the way it stops a first-time buyer.
- $2 million to $3 million is the strongest band in the Valley. Sales rose 6%, and there are fewer homes for sale than a year ago. Homes over $2 million sold 161 times, up from 150.
- The very top still takes patience. Above $5 million, sales doubled from a tiny base, but there's still more than a year's supply. Over $10 million, it's closer to two and a half years.
- Luxury buyers still negotiate more. Homes from $2 million to $7.5 million typically closed at about 94% to 96% of their final list price, versus roughly 98.5% to 99% for homes under $500,000.
What this means if you're buying
You have room to negotiate. With more homes sitting longer, sellers are more open to price cuts, repair credits and help with closing costs than they were a year ago.
You have choices. More inventory means you're less likely to get into a bidding war and more likely to find the right floor plan in the right neighborhood.
The payment is still the hurdle. Higher rates are the main reason sales slowed. That's where an assumable mortgage can change the math. Many homes in the Valley have FHA or VA loans that a buyer can take over, often at a much lower rate than a new loan. I bought my own Goodyear home this way, and I help buyers find these homes every week.
The bottom line
Zillow expects November to be even slower before things ease into the new year. For buyers who are ready, that makes the next few months one of the better windows we've seen in a while: more homes to choose from, less competition and more negotiating power.
Thinking about a move to the Valley? Call or text me at 602-483-4665, and I'll show you what's out there, including homes with assumable loans.
Sources
- Zillow: Newly pending listings fell 17% in October (Nov. 5, 2026)
- The Cromford Report (Greater Phoenix market data, based on ARMLS)
- ARMLS® COPYRIGHT 2026. Information deemed reliable but not guaranteed.
Terry Day, REALTOR®, DeLex Realty